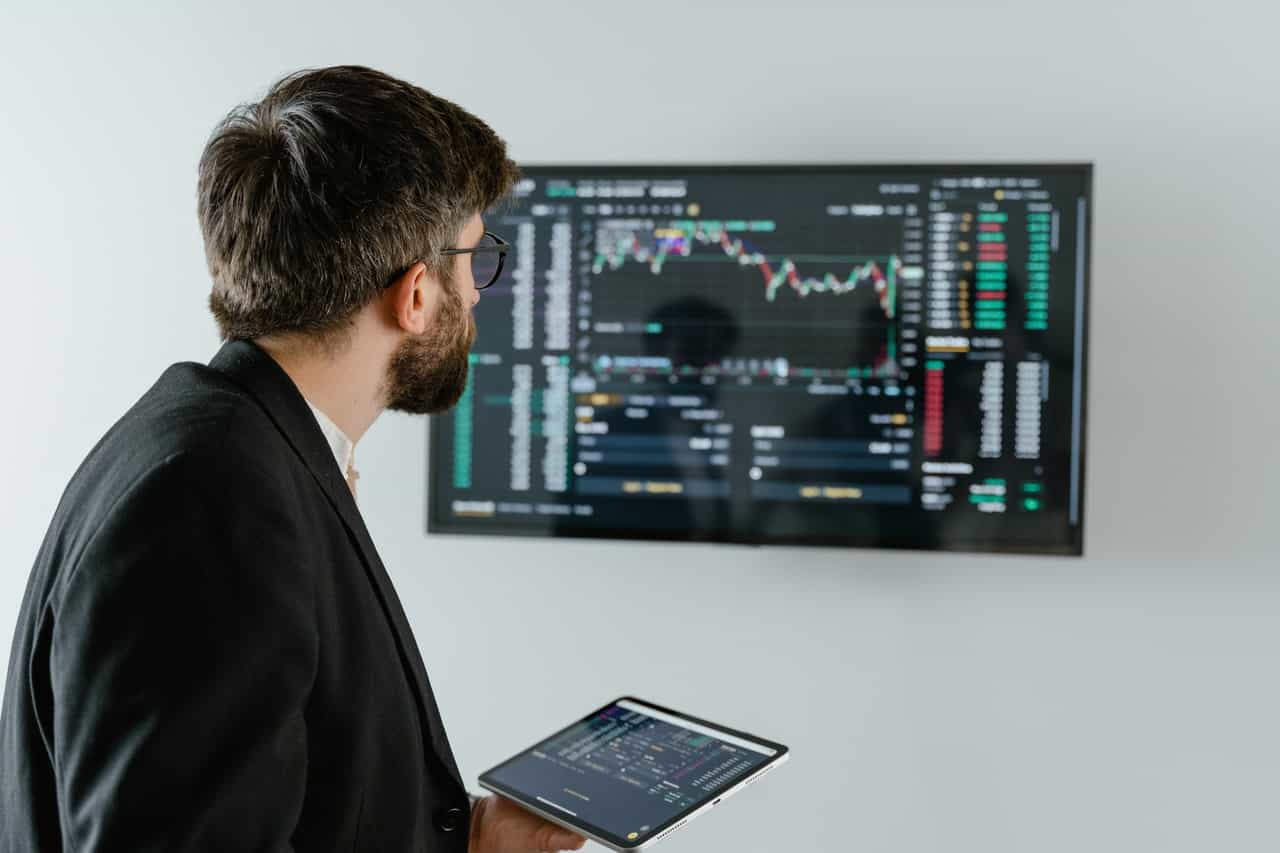
Candlestick patterns are visual formations on a price chart that many traders use to gauge shifts in market sentiment, though they work best combined with other technical or fundamental analysis rather than as standalone signals.
Key Takeaways
- Each candlestick shows the open, high, low, and close price for a given time period, forming the basis for pattern recognition.
- Single-candle patterns like Doji and Hammer can hint at indecision or potential reversal, depending on context.
- Multi-candle patterns like Engulfing and Morning Star combine two or more candles to suggest a possible shift in momentum.
- Candlestick patterns are more reliable when confirmed by volume or other technical indicators rather than read in isolation.
- No candlestick pattern guarantees a specific outcome – they reflect probability-based tendencies observed over time.
Common Candlestick Patterns and What They Suggest
| Pattern | Type | General Interpretation |
|---|---|---|
| Doji | Single-candle | Indecision between buyers and sellers, potential turning point |
| Hammer | Single-candle | Potential bullish reversal after a downtrend |
| Shooting Star | Single-candle | Potential bearish reversal after an uptrend |
| Bullish Engulfing | Two-candle | Buying pressure overtaking selling pressure, potential upward move |
| Bearish Engulfing | Two-candle | Selling pressure overtaking buying pressure, potential downward move |
| Morning Star | Three-candle | Potential bullish reversal forming over three sessions |
Why Context Matters More Than the Pattern Alone
The same candlestick pattern can carry different implications depending on where it appears – a Hammer forming after a prolonged downtrend carries more weight than one appearing in the middle of a sideways range. Traders typically look at the broader trend, volume, and nearby support or resistance levels alongside the pattern itself before drawing conclusions.
Combining Candlestick Patterns With Other Tools
- Volume: A pattern accompanied by higher-than-average volume is often considered more significant than the same pattern on low volume.
- Support and Resistance: Patterns forming near known support or resistance levels are often given more weight.
- Trend Context: Reversal patterns are generally more meaningful when they appear after an established trend rather than in choppy, directionless price action.
A Note on Over-Reliance on Patterns
Candlestick patterns are a widely used part of technical analysis, but treating any single pattern as a guaranteed signal can lead to poor decision-making. Many experienced traders use patterns as one piece of a broader analytical framework rather than a trading system on their own.
Frequently Asked Questions
What is the most reliable candlestick pattern?
No single pattern is universally “most reliable” – reliability depends heavily on context like trend, volume, and where the pattern forms on the chart.
Can candlestick patterns be used for both stocks and crypto?
Yes, candlestick pattern analysis applies broadly across stocks, forex, crypto, and other markets that use candlestick charting.
How many candles are needed to confirm a pattern?
This varies by pattern – some are single-candle formations, while others like Morning Star require two or three candles to complete.
Do candlestick patterns work better on certain timeframes?
Patterns can appear on any timeframe, though many traders find patterns on higher timeframes (daily or weekly) more significant than those on very short timeframes.
Should beginners rely heavily on candlestick patterns when starting out?
Learning candlestick patterns is a useful part of technical analysis education, but beginners are generally better served combining them with broader market context rather than relying on patterns alone.
Is candlestick charting different from a regular line chart?
Yes, candlestick charts show open, high, low, and close for each period, while a line chart typically shows only the closing price, giving candlesticks more visual information.
Using Patterns as Part of a Bigger Picture
Candlestick patterns give traders a quick visual read on potential shifts in sentiment, but their real value comes from being combined with volume, trend, and broader market context rather than used in isolation.
See also our guide to price action trading, our guide to swing trading, or the Trade Day homepage.
This article is for informational and educational purposes only and does not constitute financial, investment, or trading advice. Trading in securities, currencies, derivatives, and cryptocurrencies carries a high level of risk. Trade Day is not a registered investment advisor and has no affiliation with any broker, exchange, or platform mentioned unless explicitly stated. Do your own research and consult a licensed financial advisor before making financial decisions.