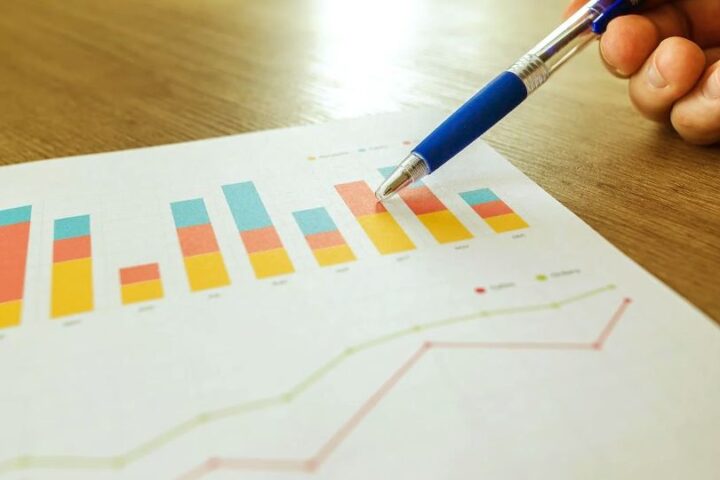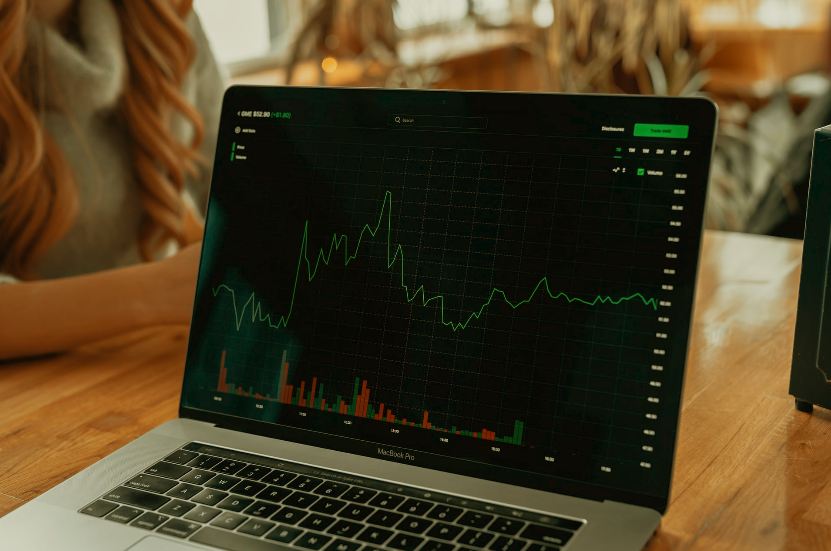
A stock chart visually represents price movement over time, and learning to read its basic elements – candlesticks, timeframes, volume, and trend direction – is the foundation for any further technical analysis.
Key Takeaways
- A candlestick chart shows the open, high, low, and close price for each time period, giving more information than a simple line chart.
- Choosing the right timeframe (daily, weekly, hourly) depends on your trading or investing style and time horizon.
- Volume, usually shown as bars below the price chart, indicates how much trading activity accompanied a given price move.
- Trend lines connecting a series of highs or lows help visualize the general direction of price movement.
- Learning to read charts is a skill built through practice and doesn’t require complex indicators to start.
Basic Elements of a Stock Chart
| Element | What It Shows |
|---|---|
| Candlestick | Open, high, low, and close price for a single time period |
| Timeframe | The period each candle represents – such as 1 day, 1 hour, or 1 week |
| Volume Bars | Trading activity for each period, usually shown below the price chart |
| Trend Line | A line connecting a series of highs or lows to visualize price direction |
| Support/Resistance Levels | Price levels where the stock has historically reversed or paused |
Understanding a Single Candlestick
Each candlestick shows four data points: the opening price, the closing price, and the highest and lowest prices reached during that period. The “body” of the candle represents the range between open and close, while the thin lines above and below (the “wicks” or “shadows”) show the high and low extremes for that period. A green or white candle typically indicates the close was higher than the open, while a red or black candle indicates the opposite.
Choosing the Right Timeframe
Longer-term investors often look at daily or weekly charts to understand broader trends, while short-term or intraday traders may use hourly or even shorter timeframes to identify entry and exit points within a single session. There’s no single “correct” timeframe – it depends on your specific trading or investing approach and time horizon.
Why Volume Adds Context
A price move accompanied by high volume is generally considered more significant than the same move on low volume, since it suggests broader participation behind the price change. Checking volume alongside price movement helps avoid over-interpreting moves that may be less meaningful than they first appear.
Frequently Asked Questions
What is the difference between a candlestick chart and a line chart?
A candlestick chart shows open, high, low, and close for each period, while a line chart typically shows only the closing price, giving candlesticks more information.
What does a green candle mean on a stock chart?
A green (or white) candle typically indicates the closing price was higher than the opening price for that period.
Which timeframe should beginners use to read stock charts?
Beginners often start with daily charts to understand broader trends before exploring shorter timeframes as they gain experience.
Why is volume important when reading a stock chart?
Volume indicates how much trading activity accompanied a price move, with higher volume generally suggesting more significant, broadly participated moves.
What is a support or resistance level on a chart?
These are price levels where a stock has historically tended to reverse direction or pause, often used as reference points by traders.
Do I need special software to read stock charts?
Most trading platforms and broker apps include built-in charting tools, so no separate software is typically required to get started.
Building Chart-Reading Skills Over Time
Reading stock charts becomes more intuitive with practice, and starting with the basics – candlesticks, timeframes, and volume – gives you a solid foundation before exploring more advanced technical analysis.
See also our guide to candlestick patterns, our guide to reading Sensex and Nifty, or the Trade Day homepage.
This article is for informational and educational purposes only and does not constitute financial, investment, or trading advice. Trading in securities, currencies, derivatives, and cryptocurrencies carries a high level of risk. Trade Day is not a registered investment advisor and has no affiliation with any broker, exchange, or platform mentioned unless explicitly stated. Do your own research and consult a licensed financial advisor before making financial decisions.